Treemap
The Treemap dashboard item allows you to visualize data in nested rectangles that are called tiles.
Providing Data
The Web Dashboard allows you to bind various dashboard items to data in a virtually uniform manner. To learn more, see the Bind Dashboard Items to Data topic.
The only difference is in the data sections that the required dashboard item has. This topic describes how to bind a Treemap dashboard item to data.
Binding to Data in the Web Dashboard
The image below shows a sample Treemap dashboard item that is bound to data.
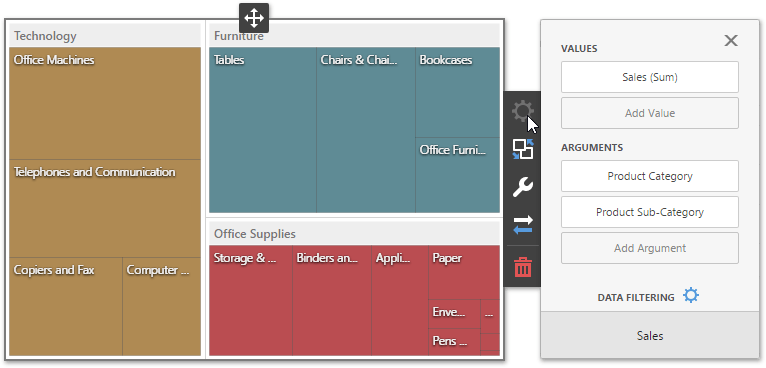
To bind the Treemap dashboard item to data, click a placeholder contained in one of the available data sections and select the required data source field in the Binding section of the invoked data item menu.
The table below lists and describes the Treemap’s data sections.
| Section | Processed as | Description |
|---|---|---|
| Values | Measure | Contains data items that provide numeric data. You can fill several data item containers in the Values section and use the Values drop-down menu to switch between the provided values. To invoke the Values menu, click the  icon in the dashboard item caption. icon in the dashboard item caption. |
| Arguments | Dimension | Contains data items that provide discrete categorical data. If the Arguments section contains several dimensions, you can group child tiles by values of the parent dimension. |
Interactivity
To enable interaction between the Treemap and other dashboard items, you can use the interactivity features, as Master Filtering and Drill-Down.
Master-Filtering
The Web Dashboard allows you to use any data aware dashboard item as a filter for other dashboard items (Master Filter). To learn more about filtering concepts common to all dashboard items, see the Master Filtering topic.
The Treemap dashboard item supports filtering by tiles/groups.
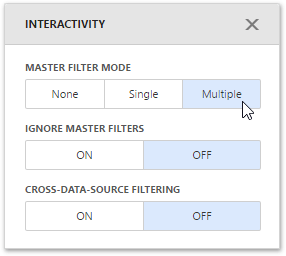
When Master Filtering is enabled, you can click a tile or group caption (or multiple tiles/groups) to make other dashboard items only display data related to the selected tile/group(s).
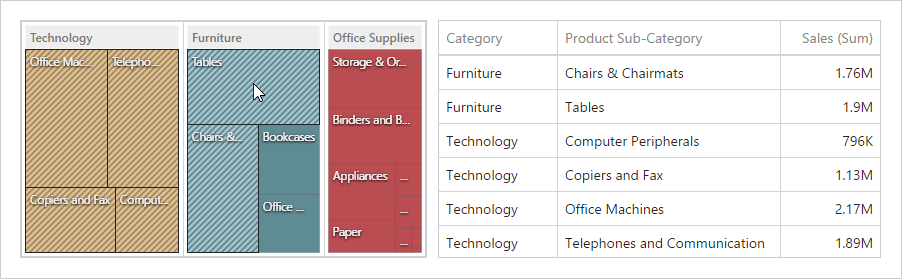
If the Single Master Filter is used, you can select only tiles corresponding to the bottommost level.
To enable Master Filtering, go to the Treemap’s Interactivity menu and select the required Master Filtering mode.
To reset multiple filtering, use the Clear Master Filter button (the  icon) in the Treemap’s caption.
Drill-Down
The built-in drill-down capability allows end-users to change the detail level of data displayed in dashboard items on the fly. To learn more about drill-down concepts common to all dashboard items, see the Drill-Down topic.
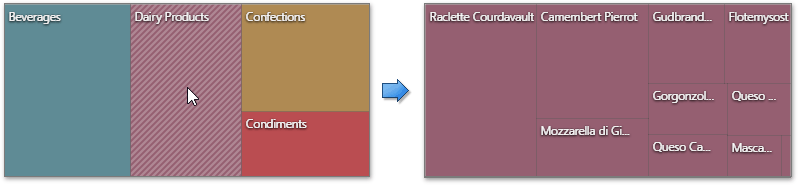
When drill-down is enabled, an end-user can click a tile to view the details.
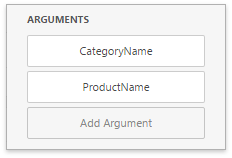
Drill-down requires that the Arguments section contains several dimensions at the top, from the least detailed to the most detailed dimension.
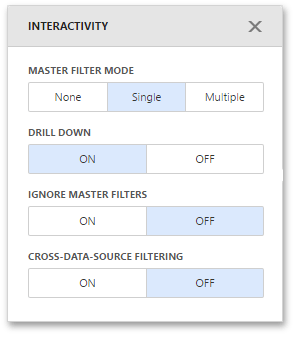
To enable Drill-Down, go to the Treemap’s Interactivity menu and turn the Drill-Down option on.
To return to the previous detail level, click the Drill Up button (the  icon) in the Treemap’s caption.
Grouping is not in effect when drill-down is enabled.
Layout
This topic describes how to change a layout algorithm used to arrange Treemap tiles. To do this in the Web Dashboard, go to the Treemap’s Options menu and open the Layout section.
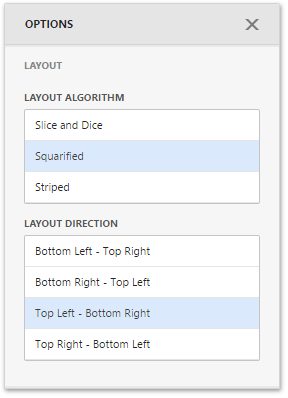
Layout Algorithm
To change a layout algorithm, select the required direction in the Layout Algorithm list. The following algorithms are available.
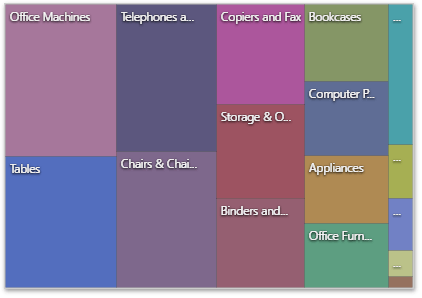
-
The Slice and Dice algorithm divides the space between items, slicing it in the specified direction depending on item value.
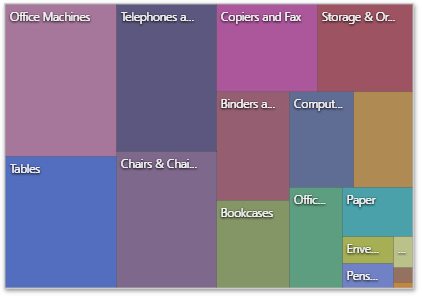
-
The Squarified algorithm arranges tiles so that their width/height ratio will be closer to 1.
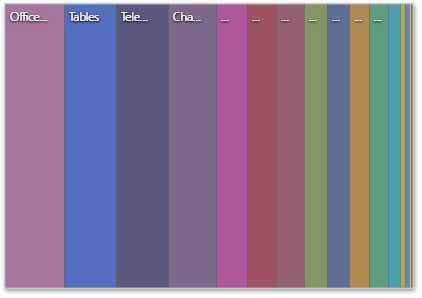
-
The Striped algorithm is a modified version of the Squarified algorithm. The difference here is that tiles are drawn side by side as columns or rows.
Layout Direction
You can also set a layout direction to specify an arrangement of tiles depending on their sizes. The Treemap arranges tiles in descending order from maximum to minimum values. To do this, select the required direction in the Layout Direction list.
- Bottom Left - Top Right arranges tiles from the bottom-left to the top-right corner.
- Bottom Right - Top Left arranges tiles from the bottom-right to the top-left corner.
- Top Left - Bottom Right arranges tiles from the top-left to the bottom-right corner.
- Top Right - Bottom Left arranges tiles from the top-right to the bottom-left corner.
Grouping
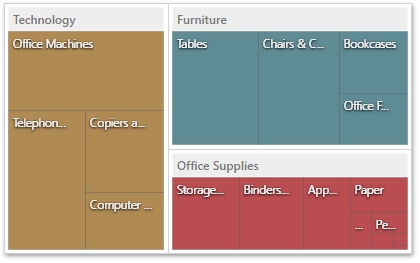
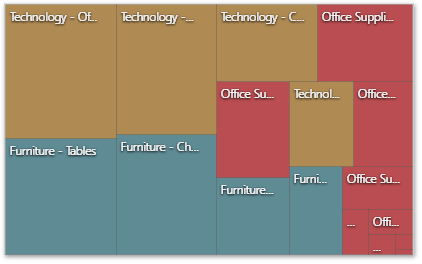
If you use several arguments in the Treemap, you can group tiles corresponding to child values by parent values. For example, the following Treemap dashboard item displays combinations of categories and sub-categories.
To group sub-categories inside corresponding categories, click the Product Category data item and go to the Tile Options section of the data item menu. There, toggle the Group Tiles option on.
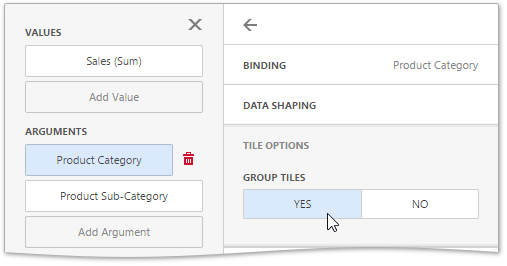
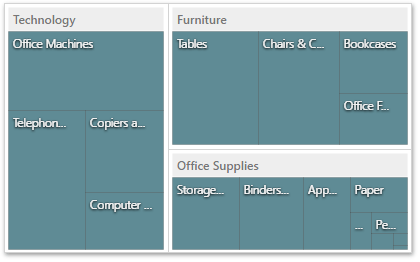
Product tiles will be grouped into category groups.
Note that grouping is unavailable for the bottommost level.
Coloring
Treemap provides the capability to color its tiles by associating dimension values/measures and specified colors. You can choose whether to use a global color scheme to provide consistent colors for identical values or specify a local color scheme for each dashboard item. To learn more about coloring concepts common for all dashboard items, see Coloring.
By default, the Treemap dashboard item colors its tiles in the following way.
- If the Treemap contains only measures (the Values section), values corresponding to different measures are colored by different hues.
- If the Treemap contains arguments (the Arguments section), values corresponding to the first argument are colored by different hues.
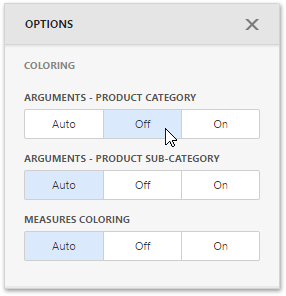
If necessary, you can change the default behavior. For example, the image below shows the Treemap dashboard item whose measures and argument values are painted with the same color.
To change the default coloring behavior, go to the Coloring section of the Treemap’s Options menu.
You can change the default palette used to color Treemap tiles. For this, go to the Color Scheme section of the Treemap’s Options menu.
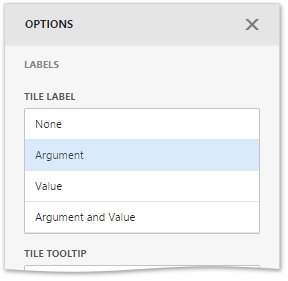
Labels
The Treemap displays labels that contain descriptions for tiles and groups, and provide tooltips with additional information.
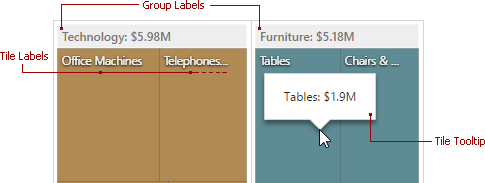
You can specify which information should be displayed within tile and group labels separately. To do this, go to the Labels section of the Treemap’s Options menu. Here you can specify a type of the following elements.
- Tile labels
- Tile tooltips
- Group labels
- Group tooltips
The available types are similar for all elements. You can set one of these types.