Step 2 allows you to select which fields appear in the report.
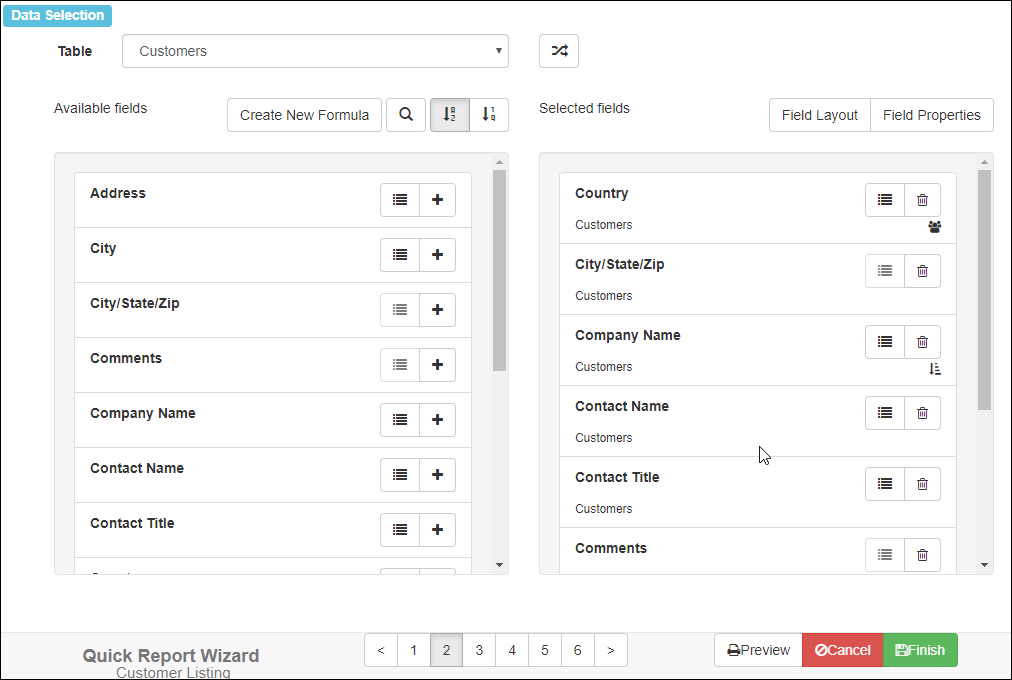
Available fields
The Available fields list shows the fields for the table selected in the Table drop-down list. You can choose fields from more than one table for a report; simply choose the desired table, add the fields you want from that table to the report, then select another table and do the same. Fields that are actually formulas have a suffix of “[Formula].”
Click the  button to have the Table drop-down list show only tables that are directly related to tables already selected for the report.
If you prefer to see the real table and field names rather than the captions, you can toggle the button to do so.
To scroll the list of fields, drag the scroll bar at the right of the list or use your mouse wheel.
Horizon Reports by default displays fields in alphabetical order. This makes it easy to find a field in the list. However, sometimes it makes more sense to display fields in the order they appear in the table. For example, for typical address fields, you would see this order alphabetically:
- Address
- City
- Contact Name
- Country
- Customer Name
- Postal Code
- Region
whereas they’d appear like this in table order:
- Customer Name
- Contact Name
- Address
- City
- Region
- Postal Code
- Country
Click the  button to display fields in table order. Click
  to display them alphabetically.
If there are a lot of fields in the Available fields list, it may be difficult to find the one you want. Click the  button and type some text in the box that appears; the list of available fields now displays only those fields containing that text somewhere in the name or caption. Click the button again to return to the full list.
The  button displays a list of the unique values in the field. This is handy if you’re not sure what data a field contains. This button may be disabled for certain fields.
The  button appears beside fields that are formulas. Click this button to edit the formula. To create a new formula, click the Create New Formula button.
Selected fields
The Selected fields list shows the fields included in the report. To add a field to the list, click the  button beside the field name in the Available fields list. Fields appear in the report in the order in which they appear in this list. To change the order in which the fields appear, simply drag the field up or down in the list. To remove a field from the Selected fields list, click the
  button.
Like the Available fields list, the Selected fields list includes the button to display a list of the unique values in the field and the button to edit a formula.
Each field may also show a status indicator to help you quickly see whether a field is grouped, sorted, or not displayed in the report.
| Symbol | Description |
|---|---|
 | This report is sorted on this field. |
 | This report is grouped on this field. |
 | This field doesn’t appear in the report because its Display in report setting is turned off. |
 | This field won’t appear in the report because the report’s Summary setting is turned on and this field isn’t grouped, included in the group header of a grouped field, or summarized. |
To scroll the list of fields, drag the scroll bar at the right of the list or use your mouse wheel.
Field Properties
Clicking the Field Properties button displays the Field Properties dialog. This dialog allows you to specify how the field is formatted.
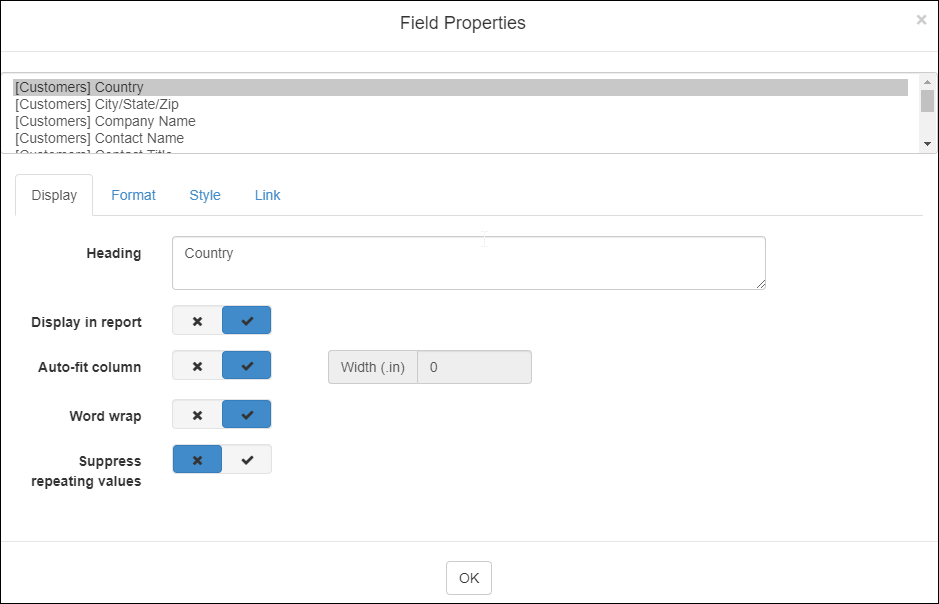
At the top of the dialog is a list of the selected fields in the report. Choose the desired field to edit its properties.
The options in the Display page of this dialog are:
-
Heading: the column heading. You can specify multiple lines for the heading by pressing Enter where a new line should start. You can expand the text area by dragging the handle in the lower-right corner of the area.
-
Display in report: if you turn this option off (it’s on by default), the field is retrieved from the database but not displayed in the report. This is useful when you want to sort on the field or include it in the query so you can link on it, but not print it.
-
Auto-fit column: if this option is turned on, which it is by default, the column is automatically sized to accommodate the widest value in the column, including the column heading.
-
Width: if the Auto-fit column option is turned off, this is used as the width for the field in the report. This value can be reduced to fit more columns on the page; the field contents and column heading automatically wrap within the reduced width as necessary or are cut off if the contents are too wide for the reduced width, depending on the setting of the Word wrap option (discussed next). Note that if you set the width to 0, the field becomes “springy;” that is, its width adjusts automatically as fields are added after it so the rightmost field doesn’t extend past the right edge of the page if possible.
-
Word wrap: this setting determines whether the contents of a field automatically wrap within the column width and span multiple lines or are cut off (the default).
-
Suppress repeating values: if this option is turned on and several records in a row have the same value in this field, only the first occurrence is printed; the field in subsequent records appears blank.
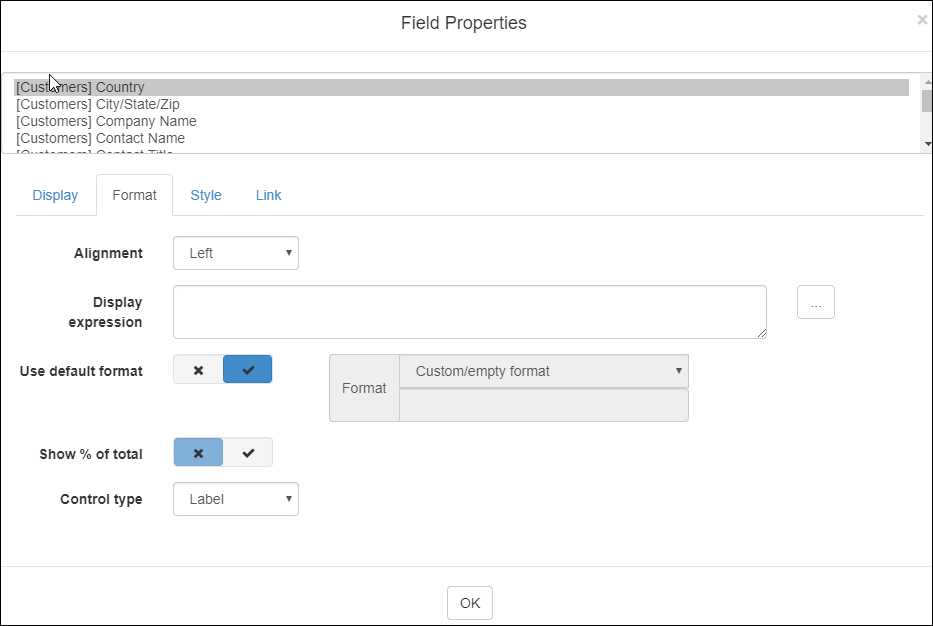
The options in the Format page are:
-
Alignment: text alignment options for field headings and field contents. By default, numeric fields are right-aligned and all others are left-aligned. You can also choose center alignment or justified, in which case the left and right edges are aligned if there’s more than one line of text.
-
Display Expression: you can specify an expression for a field, and the values of that field will be replaced with the result of evaluating the expression. If a field with a display expression is sorted on the report, the sort based on the underlying value will still be preserved. For example, if you wanted to display friendly category names, but have a report sorted by the numerical category number, you could use a display expression to accomplish this.
-
Use default format and Format: see the Formatting Values topic for details on how to format values in a report.
-
Summary type: this option allows you to specify whether a total (“sum”), average, highest, lowest, count, or count distinct value appears for this field at the end of groups and at the end of the report. Sum and Average are only available for numeric fields.
The difference between Count and Count Distinct is that Count counts the number of records while Count Distinct counts the number of records having unique values in this field. For example, if there are 100 order records but all orders were placed this week, using Count on the Order Date field would display 100 but Count Distinct would display 7 (assuming at least one order was placed every day this week).
Note that in a detail report, the Count Distinct total at the end of the report is distinct values across the entire report, while in a summary report, the Count Distinct total at the end is the sum of the distinct values in each group.
Choose the desired function from the drop-down list, or “None” for no summary value.
-
Show % of total: turn this option on to show the percentage that each value is of the total at each group break, and at each group break the percentage that the group total is of the grand total.
-
Control type: this option determines how the field is displayed. The default is Label.
| Type | Description | Example |
|---|---|---|
| Label | Displays the text of the field content. | Aniseed Syrup |
| Bar Code | Displays the content as a bar code. See below for additional options. |  |
| Checkbox | Displays a box with a checkmark in it if the field value is true or unchecked if false. |  |
| Image | Displays an image. |  |
| Rich Text | Displays formatted text if the field contains Rich Text Format (RTF) or HTML. |  |
| Zip Code | Displays the content graphically as a U.S. zip code. |  |
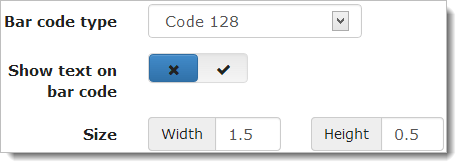
If you choose Bar Code for Control type, additional choices appear:
-
Bar code type: numerous bar code types are available, including Code 128 (the default), QR Code (for creating QR codes capable of being scanned by smart phones), and PostNet for U.S. zip codes.
-
Show text on bar code: if this is turned on, the text of the field’s value appears along with the bar code.
-
Size: specify the height and width for the bar code.
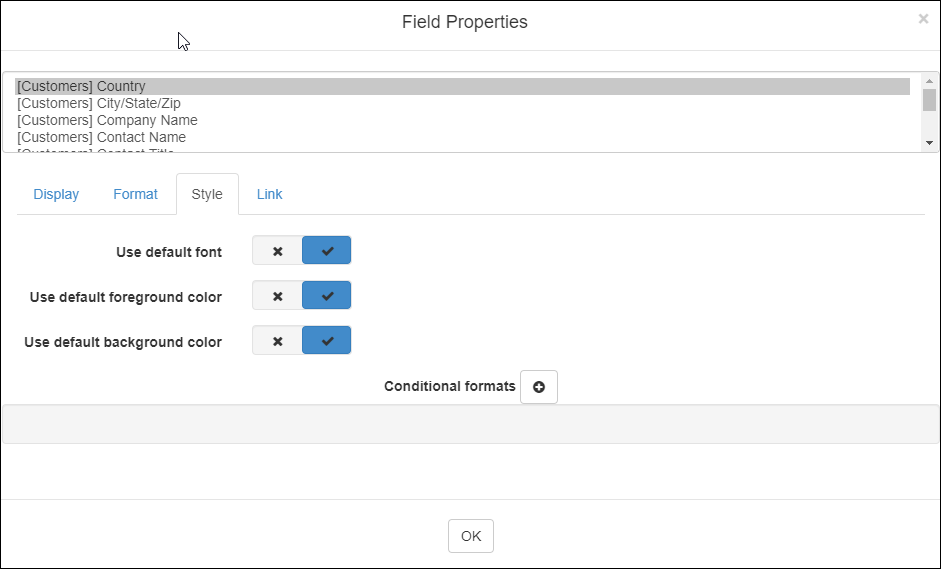
The Style page has the following options:
-
Use default font: if this option is turned on, which it is by default, this field uses the font specified in the template for the report, even if the default font is changed after the field is added to the report. To change the font, turn this option off and choose the desired font name, size, and style.
-
Use default foreground color: if this option is turned on, which it is by default, this field uses the text color specified in the template for the report, even if the color is changed after the field is added to the report. To change the color, turn this option off and choose the desired color by clicking the color bar and choosing from the Color dialog.
-
Use default background color: if this option is turned on, which it is by default, this field uses the background color specified in the template for the report, even if the color is changed after the field is added to the report. To change the color, turn this option off and choose the desired color by clicking the color bar and choosing from the Color dialog.
-
Conditional formats: conditional formats allow you to conditionally change the font or color of the field’s value based on a condition. Click the
 button to add a condition. The following options appear:
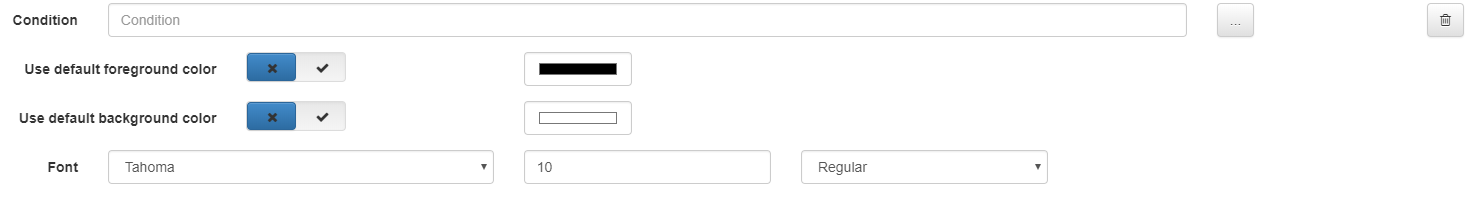
-
Condition: the expression for the condition. This can use any valid expression, including any of the built-in functions you wish. The condition must evaluate to a Boolean (true or false or yes or no) value. For example, using an expression of “Freight > 40” and a foreground color of red for the Order Date field results in:
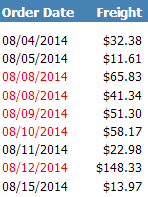
For literal strings, use single quotes; for example, Country=’Germany’. Note that you must type the real field name, not the descriptive name, and any fields you reference in the condition must be included in the report. If you don’t want those fields to appear, turn off Display in report for those fields.
-
Use default foreground color: If this is turned off, you can specify the foreground color to use if the expression is true. If the setting is turned on, the foreground color of the field or template is used in all cases (even if the expression is true).
-
Use default background color: If this is turned off, you can specify the background color to use if the expression is true. If the setting is turned on, the background color of the field or template is used in all cases (even if the expression is true).
-
Font: the font name, size, and style to use if the expression is true. If the expression is false, the font settings of the field or template are used.
You can create as many conditional formats as you wish. Click the
button to remove a conditional format. -
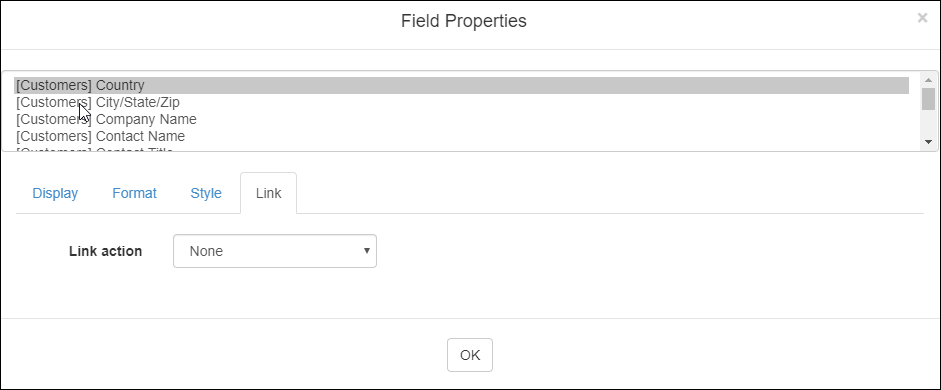
The Link page allows you to link the selected field to an email dialog or a web site. A linked field appears as a hyperlink in the report Preview window. When you click a linked field in the Preview window, one of a couple of things happens:
-
For email links, the New Message dialog of your email program is brought up with the email address already filled in.
-
For web site links, another tab in your web browser opens and navigates to the web site.
The options on this page are:
-
Link action: choose the desired link type.
-
Email field: this option, which only appears if Link action is set to Email, specifies which field contains the email address to link to. Only fields selected for the report appear in the list of fields, so be sure to include the desired field in the report. If you don’t want that field to actually appear in the report, turn off the Display in report setting on the Display page for that field.
-
URL field: this option, which only appears if Link action is set to URL, specifies which field contains the URL, or web site address, to link to. Only fields selected for the report appear in the list of fields, so be sure to include the desired field in the report. If you don’t want that field to actually appear in the report, turn off the Display in report setting on the Display page for that field.
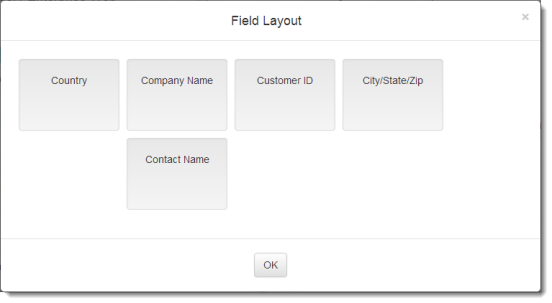
Field layout
Horizon Reports lays out fields in the Selected fields list horizontally, from left to right, in the order they appear in the list. As noted earlier, you can rearrange the order by dragging a field up or down in the list to the place you want it to go. However, you can also stack fields vertically by clicking the Field Layout button and rearranging fields in the Field Layout dialog. To move one field below another, drag it into the desired position. The way fields appear in the dialog is roughly how they’ll appear when you run the report.