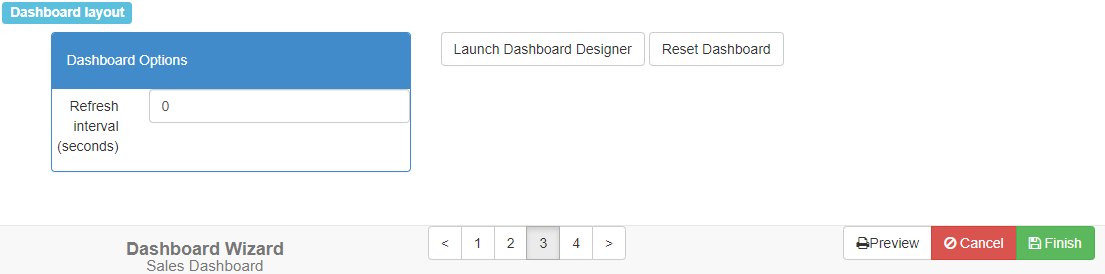
Step 3 allows you to control the layout of the reports in the dashboard and how often they refresh.
By default, Horizon Reports lays out reports automatically to best fit the window. The default visualization for each report depends on the type of report. Quick reports are displayed with a data grid, crosstabs with a pivot grid, and charts are displayed with a bar diagram.
Refresh interval: a dashboard automatically refreshes the data in each of its reports at an interval you determine. The default is every 120 seconds (2 minutes) but you can set it to a different value if you wish. If you don’t want the dashboard to refresh the data, set the value to 0.
To customize the layout or change the visualization for any of the reports, use the Launch Dashboard Designer button to launch a design tool that allows you to make these changes.
You can use the Reset Dashboard button to delete any changes made in the dashboard design tool. Doing so will reset the layout and visualizations for the dashboard to default values.