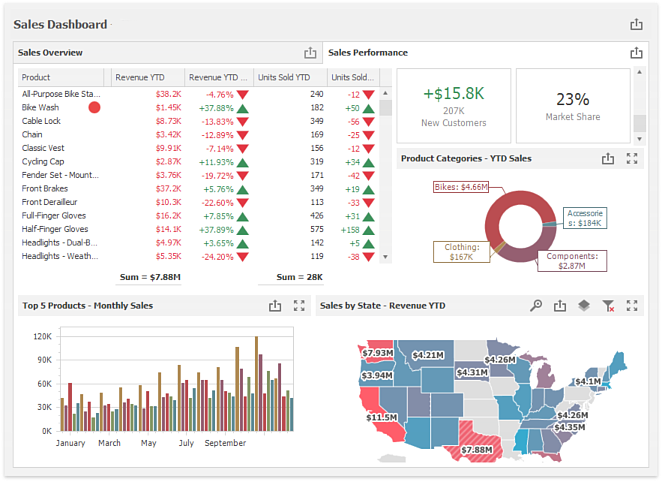
A dashboard allows you to display a number of inter-connected data analysis elements such as grids, charts, maps, gauges, and others. You can use your existing reports as data sources for the dashboard, but then visualize that data in different ways.
The elements in the dashboard refresh themselves at an interval you specify (the default is every 120 seconds) so the data is always current.
You run a dashboard by previewing it. Note that the preview displays in a separate tab in your browser.
You can create a shortcut on your desktop that displays the dashboard by dragging from the address bar of your browser to your desktop. Simply double-click that shortcut to open the dashboard in your browser (note that you may be asked to log in).
There are four steps in the Dashboard Wizard:
-
Step 1: Information: specify the dashboard name, comments, and tags.
-
Step 2: Report Selection: choose the reports for the dashboard.
-
Step 3: Dashboard Layout: specify dashboard options and how the reports are visualized and arranged.
-
Step 4: Security: specify security options.
To move from one step to another in the wizard, click the next or previous buttons or choose a specific step number from the toolbar at the bottom.
The bottom right of the wizard has buttons to preview, cancel editing the dashboard, or finish and save it.