Suppose you want a list of customers whose total sales are more than $500. Creating a filter condition of “Invoice Amount is greater than 500” won’t do that because filter conditions work on individual records. In that case, the report shows those customers who have individual invoices of more than $500. To create a filter based on a total, you need to use a grouping condition instead.
The filtering step (step 4) of the Quick Report Wizard has three types of conditions: filter conditions, exclude conditions, and grouping conditions. To create a grouping condition, click the Grouping conditions button. Grouping conditions work similar to filter conditions—you can create multiple conditions and group them if necessary—but have some additional settings you have to fill in.
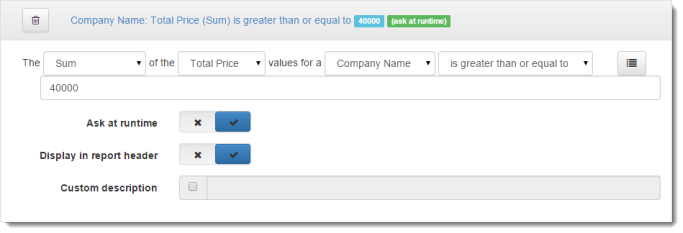
The first thing you have to select is the type of summarization to do to the data to create the value for the filter. The choices are Sum, Average, Highest, Lowest, Count, Count Distinct, or Concatenation. Sum and Average are only available for numeric fields. Concatenation is used for text fields when you want to combine the values of several records into a single, comma-separated value in one record.
The difference between Count and Count Distinct is that Count counts the number of records while Count Distinct counts the number of records having unique values in this field. For example, if there are 100 order records but all orders were placed this week, using Count on the Order Date field would display 100 but Count Distinct would display 7 (assuming at least one order was placed every day this week).
The next thing to select is the field to do the summarization on. In the example above, it would be Invoice Amount. The drop-down list of fields only displays those fields in the report, so be sure to add the field you want to use to the Selected fields list in step 2.
Next choose the field to do the grouping of values on. In the example above, it would be Customer Name. As with the summarization field, this field needs to be included in the report.
As with a regular filter condition, choose the operator for the grouping condition from the drop-down list and enter the values for the condition.
If you want to be prompted to enter the values when you run the report, turn on the Ask at runtime option.
By default, grouping conditions are displayed in the header of the report. If you don’t want a particular condition to be displayed, turn off the Display in report header setting. This is useful for reports that have a lot of conditions, which can get quite long when listed in the report header. You might in that case turn this option off for all but ask-at-runtime conditions.
The condition is displayed in the report header as Field Operator Value, such as “City equals San Francisco” or “Active Is Yes.” If you want to customize the description, turn on Custom description and enter the desired description. For example, “Active customers” might be a more meaningful description than “Active Is Yes.” If you want to use an expression rather than fixed text, surround the expression with “{“ and “}” (without the quotes). Note that the expression must evaluate to a string value, so use the Str() function if necessary to convert non-string values such as dates and numbers to their string equivalent.