A cross-tabulation (or “cross-tab”) report is one that summarizes information in your database. It’s laid out in a grid, with rows representing one “fact” (for example, country, date, or salesperson), columns representing another, and the intersection of rows and columns containing the summarized information. It’s similar to a PivotTable in Microsoft Excel.
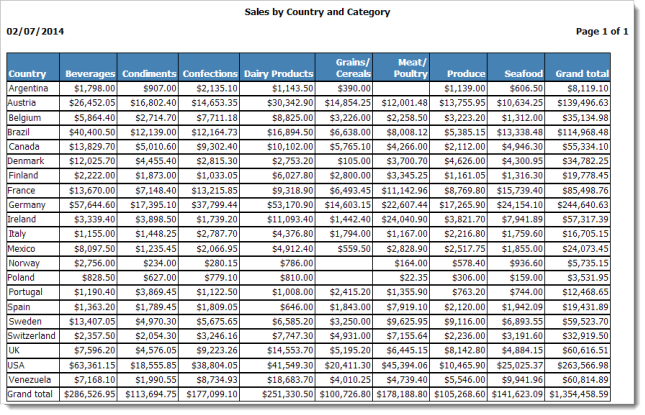
For example, you may want to see a breakdown of your sales by country and product category. In this case, the rows would be the different countries your customers are in, the columns would be the category names, and the cell at the intersection of a specific row and column would be the total sales for that category in that country.
To create a cross-tab report, select at least three fields you want to appear in the report, and then select where each field goes. A row field is one that has each different value appear in a row in the report. A column field is one that has each different value appear in a column in the report. A data field is one that’s summarized and placed in the cells at the intersection of rows and columns.
Here are some notes about how cross-tabs work:
-
You can have more than one row field. For example, you may want sales by country and within country, by state. Choose both the country and state fields, and select country as the first row field and state as the second. The report shows each state in each country, with subtotals for each country.
-
You can have more than one column field. For example, you may want product category and within category, by product name. Choose both the product category and product name fields, and select product category as the first column field and product name as the second. The report shows each product in each category, with subtotals for each category. Note that using more than one column field can make the report much longer and take more time to run.
-
You can specify how the data field is summarized. For numeric fields, the default is to sum the values, but you can use another type of summarization, such as average. For all other types of fields, you can only have it count the number of values.
-
If you use a date field as a row or column field, you can specify how the date is displayed. For example, you may want to show the month or year rather than the individual dates.
-
You can have more than one data field. For example, if you want to show not only the total sales amount but also the count of how many sales there were, select the amount field and some other field, and make them both data fields. The amount field is summed and the other field is counted.
-
Since there may be a lot of rows and/or columns, depending on the fields you choose, Horizon Reports automatically horizontally paginates the report for you. This is similar to how spreadsheets like Microsoft Excel print multi-page reports. Horizon Reports prints a page for the first set of rows and columns, then the next page has the same set of rows but more columns, and so on until all of the columns have been printed. Then it prints the next set of rows and the first set of columns, and continues in this manner until all columns and all rows have been printed.
-
There are optionally totals for each row and each column, and a grand total at the end of the report.
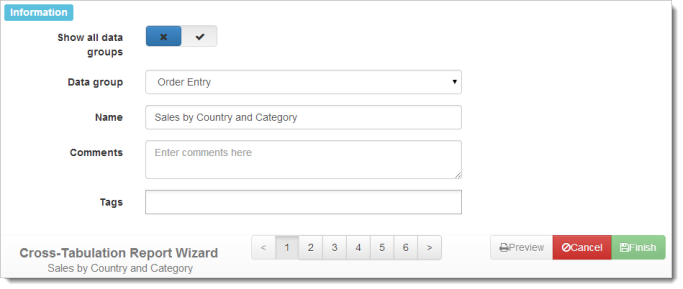
There are six steps in the Cross-Tabulation Report Wizard:
-
Step 1: Information: specify the report name, comments, and tags.
-
Step 2: Data Selection: choose the fields for the report and how they should be formatted.
-
Step 3: Cross-Tabulation Layout: select what area fields go in.
-
Step 4: Filtering: choose which records to include and exclude.
-
Step 5: Report Options: specify the orientation, template, paper size, margins, and other options.
-
Step 6: Security: select which roles can access the report.
To move from one step to another in the wizard, click the next or previous buttons or choose a specific step number from the toolbar at the bottom.
The bottom right of the wizard has buttons to preview the report, cancel editing the report, or finish and save the report. You can preview your report any time after you have selected at least three fields in step 2 and defined where those fields go in step 3. This is handy, since you can change something in the report, preview it to see how it looks, change it, preview again, and so on.