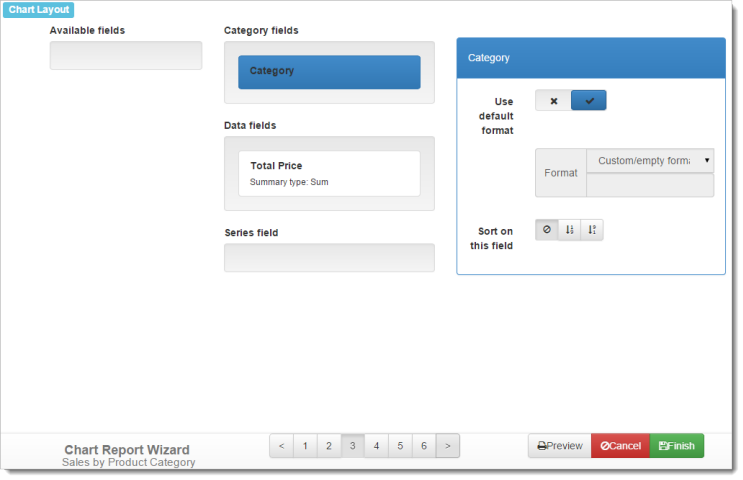
In Step 3, you specify which fields appear in which places in the report. The way you do that is by dragging a field name from the Available fields list to the appropriate section. There are three places a field can appear:
-
A category field appears in the category, or X, axis of most types of charts. For others, such as pie charts, a category field is used for something else, like the slices of a pie. For example, to show a chart of sales by product by year, use the product name as the category field.
-
A data field is the numeric value for each category item in the chart. For some types of charts, this is used to determine the size of a shape, such as the slice of a pie. For all other charts, it’s used for the values, or Y, axis. For example, to show a chart of sales by product by year, use the sale amount as the values field.
-
A series field is used to create multiple charts. For example, to show a chart of sales by product by year, use the sale date as the series field and display the year rather than individual dates using the Field Properties dialog. Not all charts have a series field.
For example, to use the Amount field as a data field, select it in the list and drag it to the Data fields section. Any fields left in the Available list are not used in any way in chart reports.
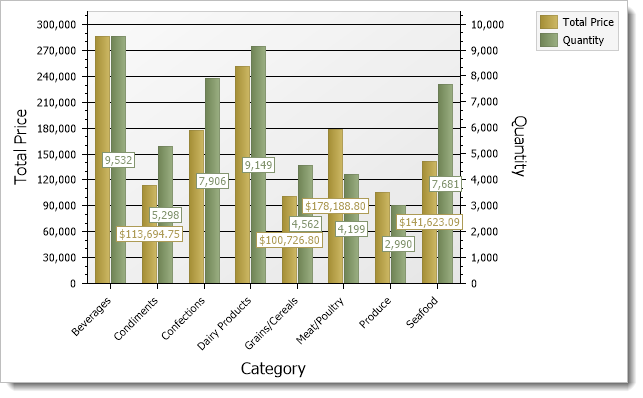
You can only have one category and one series field; if you try to drag more than one field into those areas, a warning displays and the field returns to its former location. However, you can have more than one field in the data section: in that case, each field is charted separately as a series. If you have more than one data field, you can’t have a series field. If you have a series field, you can’t drag more than one field to the data area.
Here’s an example that shows Total Price and Quantity both used as data fields:
To remove a field from a section in the report, drag it from the appropriate box back to the Available fields list.
To change the properties of a field in the Series field list, select it to display its properties at the right. The only choices are Use default format and Format; see the Formatting Values topic for details on how to format values in a report.
To change the properties of a field in the Category field list, select it to display its properties at the right. The choices are:
-
Use default format and Format: see the Formatting Values topic for details on how to format values in a report.
-
Sort on this field: by default, the report is not sorted. If you want the results sorted on the values of the category field in ascending (from lowest to highest) or descending (highest to lowest) order, click the appropriate button:
 or
or  . Click the
  button to turn off sorting on the category field.
Fields in the Data fields list show the summary type for the field, which by default is Sum for numeric fields and Count for all other field types. To change the properties of fields in this list, select it to display its properties at the right. The choices are:
-
Use default format and Format: see the Formatting Values topic for details on how to format values in a report.
-
Summary type: this option allows you to specify whether a total (“sum”), count, count distinct, average, highest, or lowest value appears for this field. The difference between Count and Count Distinct is that Count counts the number of records while Count Distinct counts the number of records having unique values on this field. For example, if there are 100 order records but all orders were placed this week, using Count on the Order Date field would display 100 but Count Distinct would display 7 (assuming at least one order was placed every day this week). Choose the desired function from the drop-down list.
-
Sort on this field: by default, the report is not sorted. If you want the results sorted on the values of the data field in ascending (from lowest to highest) or descending (highest to lowest) order, click the appropriate button:
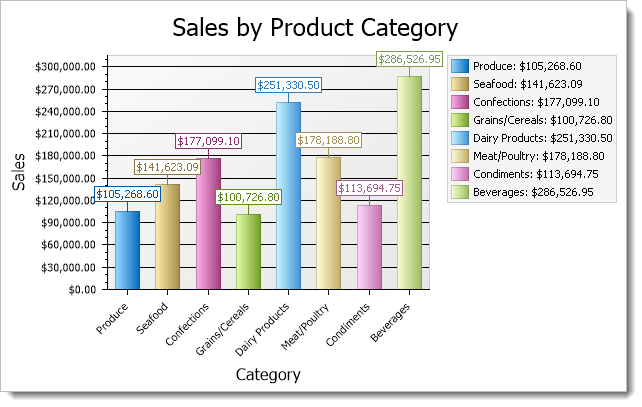
or . Click the button to turn off sorting on the data field.For example, here’s a report that isn’t sorted on the data field. Notice that it’s in alphabetical order by category.
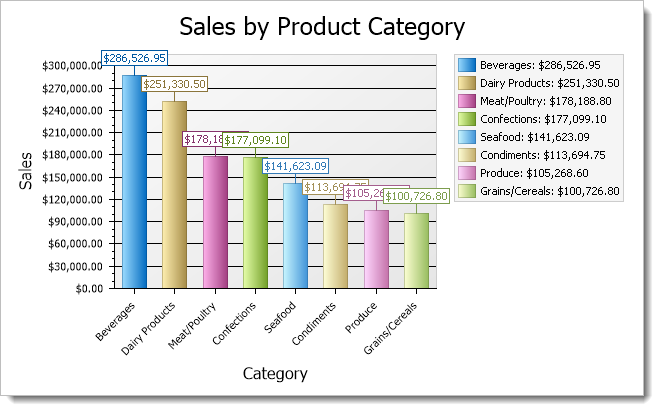
This one is sorted in descending order on the data field, so the bars are arranged with the largest total sales at the left.
-
Axis location: this option, which only appears if there’s more than one data field, allows you to choose which axis, left or right, is used to display values for the selected field. The default is Left axis.