Step 2, in which you select which reports appear in the dashboard, is shown below:
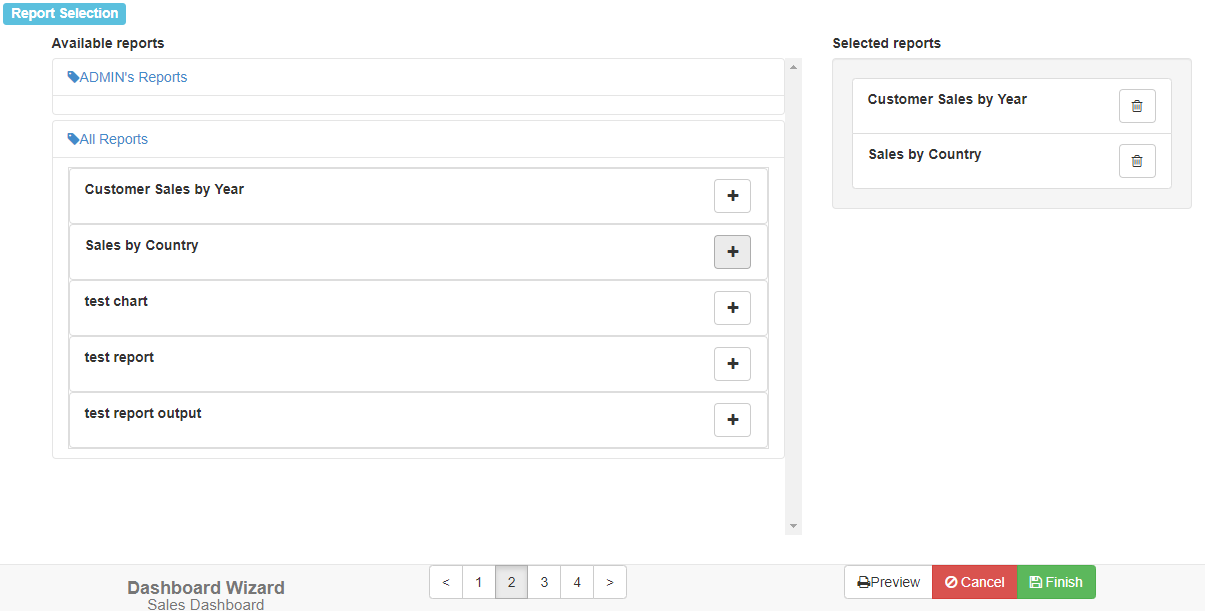
A list containing reports appears at the left. The charts are organized by the same tags they are in the Reports Explorer. Reports that have ask-at-runtime filter conditions aren’t shown because dashboards may run unattended and therefore shouldn’t prompt the user for any values. To hide or show the reports for a tag, click the tag bar.
A list showing the reports included in the dashboard appears at the right. To add a report to the list, click the  button beside the report name in the Available reports list. To remove a report from the Selected reports list, click the
  button.