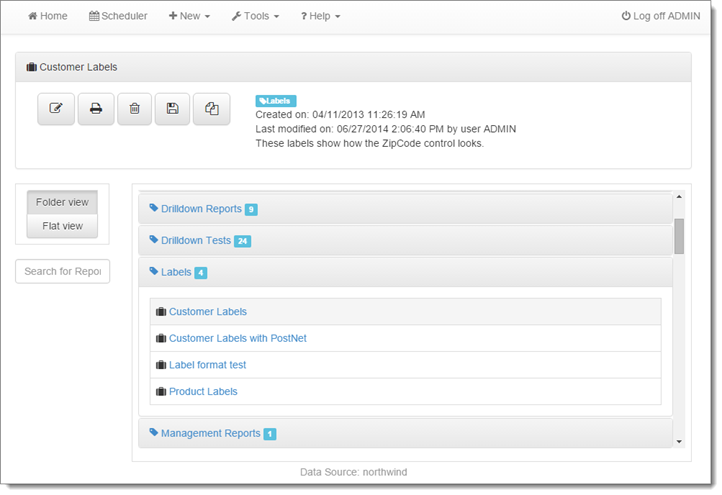
The Reports Explorer appears as follows:
The menu across the top has the following functions:
-
Home: displays the Reports Explorer.
-
Scheduler: displays a list of scheduled reports.
-
New: contains functions to create a new report (if you’re using a Report Designer license; users with Report Viewer licenses cannot create reports) and a new schedule (if you have permission to create schedules).
-
Tools: contains the Tags, Options, Formulas, Templates, Manage Reports, Security, Change Password, Change Data Source, Import Report, Export Report, Setup, Download application log, Download Support Package, and Upload a Logo Image functions. Note that some of these functions are only available to administrator users.
-
Help: has functions to display help, submit a support ticket, display the About dialog, or launch the Reports Explorer training.
-
Log off: logs you off and display the Login page.
Below the menu are controls for the selected report. To select a report, click in the space to the right of its name in the reports list.
The name of the report appears at the top. An icon indicates the report type:
-
 : a quick report, a row-and-column style report that’s the most common type.
 -
 : a label report, used for address labels, bar code labels, product labels, etc.
 -
 : a cross-tab report, similar to a pivot table in Microsoft Excel.
 -
 : a chart report, showing a bar graph, pie chart, line graph, etc.
 -
 : a dashboard, which includes other reports or charts.
 -
 : a batch report, which combines other reports into a single output file.
Below that is a toolbar with functions for the report:
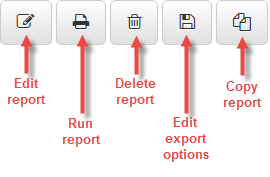
Note that the Edit and Copy buttons only appear if you’re using a Report Designer license since users with Report Viewer licenses cannot edit or copy reports. When a report viewer license is in use, the edit button is replaced with an Edit filters button  instead.
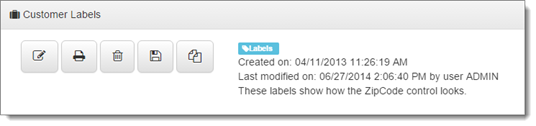
Information about the report appears to the right of the toolbar: the tags associated with it, who created it and when, who last modified it and when, and comments.
Below the current report section is the reports list showing which reports you can access. It displays an icon indicating the type of report. You can preview a report by clicking its name.
The list is organized by tag. Although you can create as many tags as you wish, one tag is automatically created for you: All Reports, which automatically includes all reports. Because a report can have more than one tag, it might appear in the Reports Explorer more than once. To hide or show the reports for a tag, click the tag bar. For example, in the image above, the Drilldown Tests and New/Modified Reports tags are collapsed but the Labels tag is expanded. The bar also shows the number of reports for the tag.
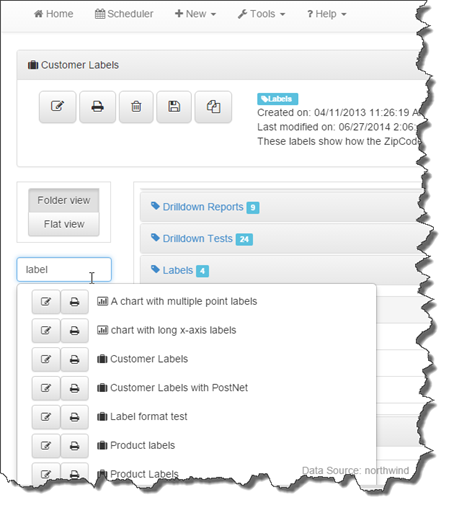
If you have a lot of reports, it might be hard to find the one you’re interested in amongst all the reports in the Reports Explorer. Type something the Search for Reports box to display a list of all reports containing that text somewhere in the name or comments of the report. The list contains buttons to edit and preview the report.
If you want to filter the reports displayed in the Reports Explorer to only those using certain tags, click Flat View. Click Folder View to return to the display showing reports grouped by tag.
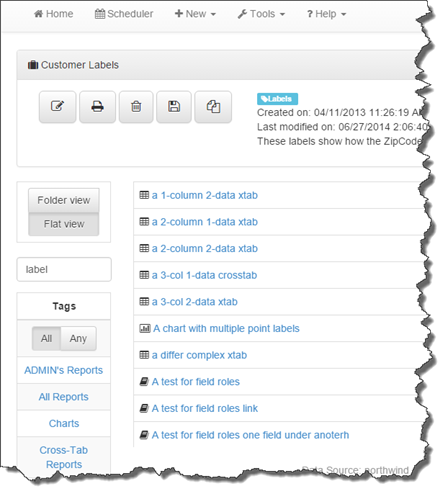
Reports in flat view are displayed in alphabetical order without being grouped by tag. To display only reports using a specific tag, click that tag’s name in the list at the left; a check mark appears beside the tag. To select reports using more than one tag, click on another tag. As you can see, in this case, only one report uses both of the selected tags:
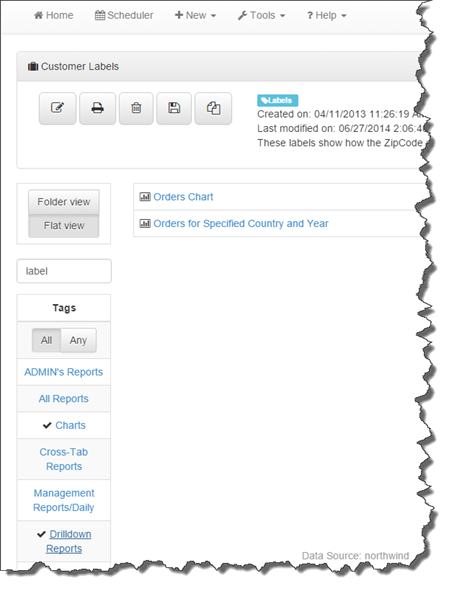
If you want to see reports that use either rather than both tags, click the Any button. Click All to return to displaying only reports that use all selected tags. Click a tag’s name again to turn off its check mark and not use it as a filter.
The bottom of the Reports Explorer shows the data source used for reports (a data source is a particular database you want to report on). You can change to a different data source any time by choosing the Change Data Source function from the Tools menu.